---
description: "A tour of the new Dalton platform: the Overview, CRO Agent, Analytics, Experiments, the Editor and Connectors."
---

<div class="hero-section">

# The New Dalton

A guided tour of the Dalton platform: what each section does and when to use it.

</div>

<div class="gradient-divider"></div>

## Overview

![The Dalton Overview page](/new-dalton/overview.png)

The Overview is your home base. It answers three questions at a glance: how the account is performing, what Dalton is recommending next, and what is live right now.

**Recently Launched** lists your most recent experiments with their measured uplift and the sessions behind it, so you can see how live tests are trending without leaving the page. Alongside it, **Your website, analysed** surfaces the pages Dalton has flagged as underperforming or standing out, linking through to the analytics.

## CRO Agent

![The CRO Agent page, showing an audit and the problems it found](/new-dalton/cro-agent.png)

The CRO Agent runs a recurring, in-depth scan of your brand and reports back the opportunities it finds.

Each audit is grounded in the analytics data, so recommendations reflect how visitors actually behave rather than generic best practice. The panel at the top shows the current audit, including when it ran, how many pages it visited, how many online searches it performed, and when the next scan is due. You can expand **Read steps** to see the agent's reasoning, or trigger a **custom scan** whenever you want to look at something specific.

Findings are listed and ordered by impact. Every one comes with an explanation of what is going wrong, an impact rating, the projected effect on conversion rate, and a screenshot pinpointing the issue on your site. Each problem arrives as a ready-to-implement experiment: **Review** takes it forward, **Deny** clears it from the list.

## Analytics

![The Analytics page, showing the conversion funnel and page breakdown](/new-dalton/analytics.png)

Analytics gives you the full conversion funnel for your brand, across whichever period you select.

The breakdown underneath shows which parts of the site are responsible. Switch between **Pages**, **Page groups**, and **Markets**, and narrow to entry pages only when you want to judge landing performance in isolation. Dalton ranks your **top performing** and **worst performing** pages side by side, with sessions, conversion rate, and bounce rate for each. For the underperformers, you also get an estimate of the conversions being lost.

A **Traffic** panel breaks incoming sessions down by channel or referrer, with the conversion rate each one delivers.

## Experiments

![The Experiments page, with experiments grouped by the pages they target](/new-dalton/experiments.png)

The Experiments page lists every experiment in the account, grouped by the pages they target.

Each group shows a thumbnail of the page and the experiments attached to it, with live status, uplift, sessions, and experiment type. Drafts sit alongside running tests, so nothing gets lost between idea and launch. Use the controls in the **top left** to narrow the list. Search by name, or filter by market, tag, or status.

<div class="split-row">
<div class="split-text">

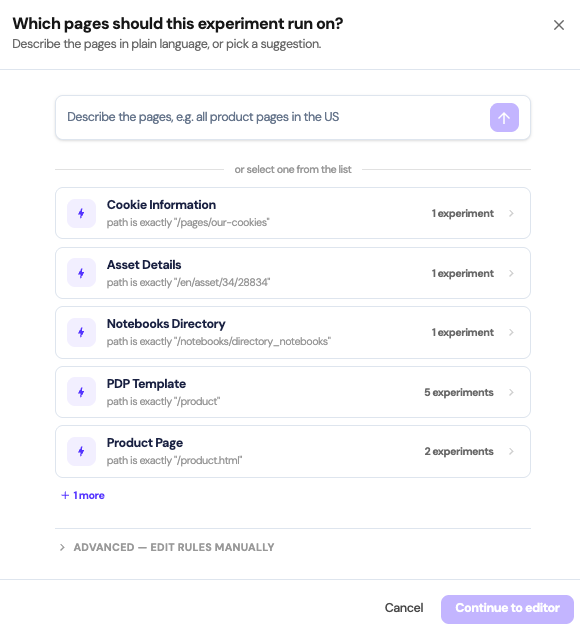
New experiments start from the **top right**. Dalton first asks which pages the experiment should run on.

Describe them in the prompting bar, such as *all product pages in the US*, or pick from the page groups it has already detected on your site. If you need precise control, the advanced option lets you write the targeting rules by hand. Once the pages are set, you continue into the editor to build the variants.
</div>
<div class="split-image">

![Choosing which pages an experiment should run on](/new-dalton/new-experiment.png)

</div>
</div>

## The Editor

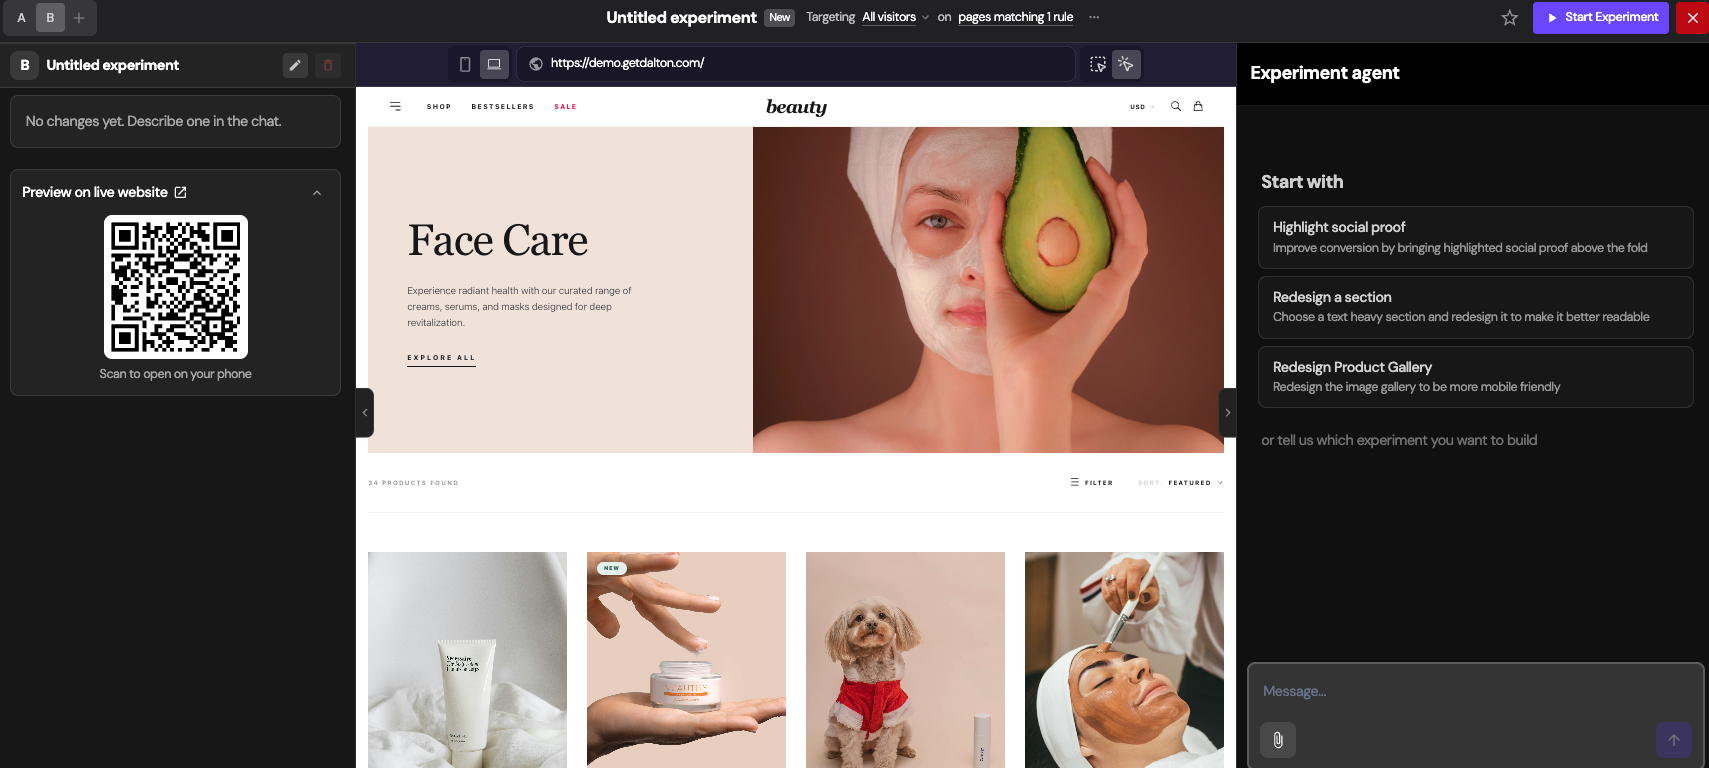
![The Dalton editor, with the variant view on the left, a live preview in the centre, and the Experiment agent on the right](/new-dalton/editor.png)

The editor is where a variant gets built. It opens on the page you targeted, with your variants along the top. Switch between them, or add another with **+**.

The **left panel** is the variant view. It carries the variant's name, and beneath it every change made to that variant is listed out, so you can see the full set of modifications at a glance rather than hunting for them on the page. A fresh variant starts empty, prompting you to describe your first change. The panel also holds a **Preview on live website** link and a QR code, so you can scan and open the variant on your phone to check it on a real device.

The **centre** is a live preview of your site. Toggle between mobile and desktop, and use the selection tools to point the editor at a specific element on the page.

The **right panel** is the Experiment agent, a prompting window for building and fine-tuning. It opens with a few suggested starting points drawn from your page. Keep prompting to refine what the agent produces until the variant is right.

**Start Experiment** takes it live.

## Connectors
![The Connectors page, showing tracking, analytics, store and ad platform integrations](/new-dalton/connectors.png)

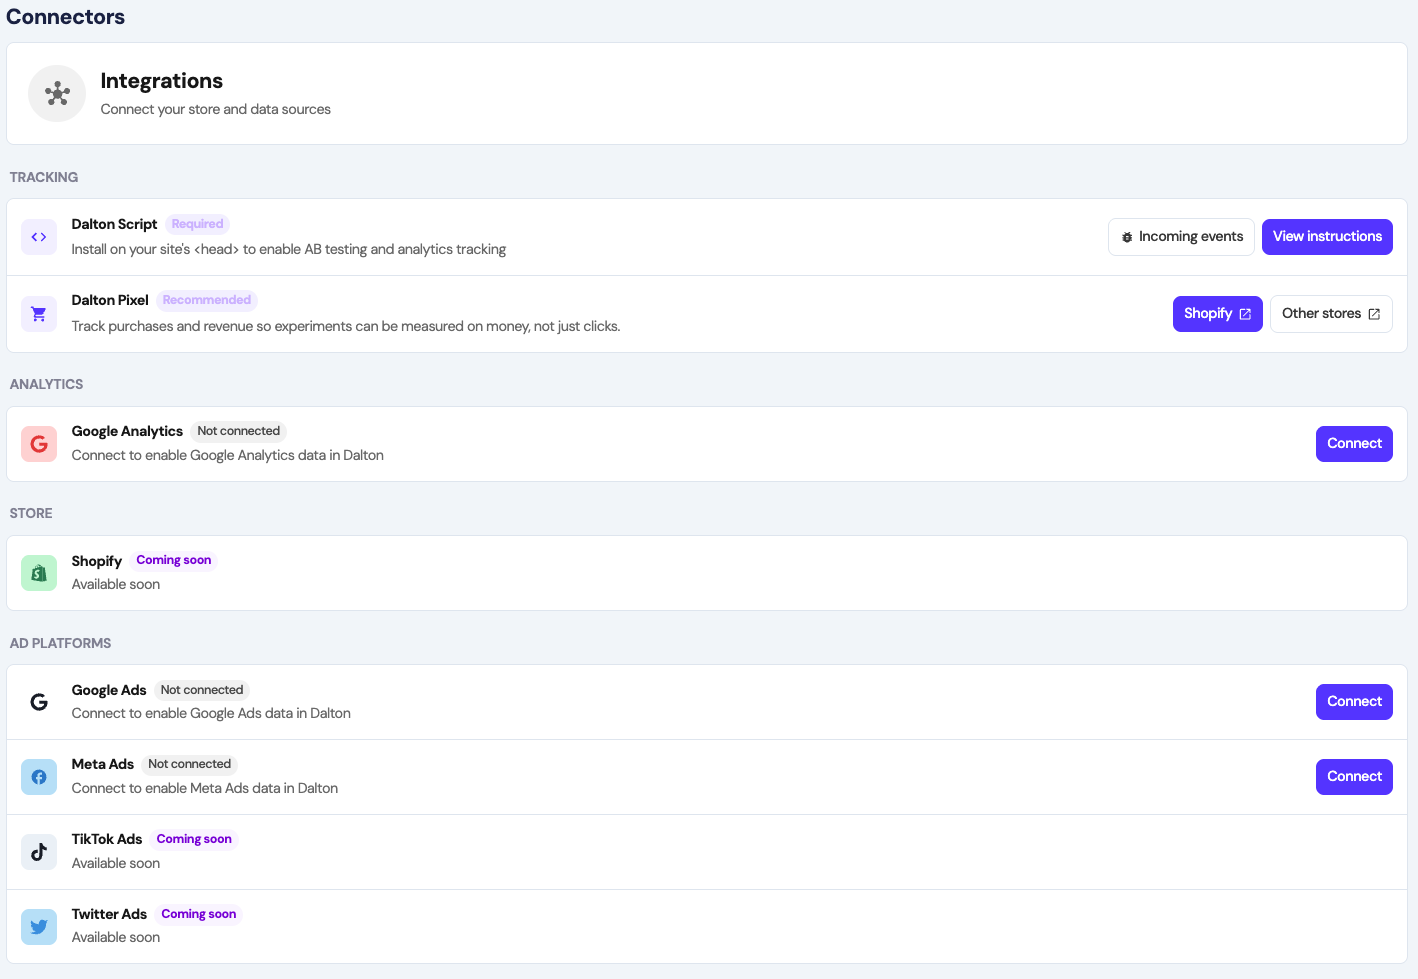
Connectors is where you confirm Dalton is receiving data and connect the rest of your stack.

**Tracking** comes first. The Dalton Script is required. It goes in your site's `<head>` and powers both A/B testing and analytics tracking. You can check incoming events here to confirm it is live, or open the installation instructions if it is not. The Dalton Pixel is recommended on top of it: it tracks purchases and revenue, so experiments are measured on money rather than clicks alone.

From there you can link your **analytics** and **ad platforms**, with each integration showing its current connection status. Connecting these feeds richer data into the CRO Agent and analytics.

<style>
.hero-section {
  position: relative;
  padding: 2rem 0 0.5rem 0;
  margin: -24px -24px 0 -24px;
  padding-left: 24px;
  padding-right: 24px;
  background: linear-gradient(180deg, rgba(85, 31, 255, 0.03) 0%, transparent 100%);
}

.dark .hero-section {
  background: linear-gradient(180deg, rgba(85, 31, 255, 0.06) 0%, transparent 100%);
}

.gradient-divider {
  height: 1px;
  margin: 0.75rem 0 1.5rem 0;
  background: linear-gradient(90deg, transparent, rgba(85, 31, 255, 0.3), rgba(31, 235, 128, 0.3), transparent);
}

.split-row {
  display: flex;
  align-items: flex-start;
  gap: 2rem;
  margin: 1.5rem 0;
}

.split-row .split-text {
  flex: 1 1 50%;
  min-width: 0;
}

.split-row .split-image {
  flex: 1 1 50%;
  min-width: 0;
}

.split-row .split-text > :first-child {
  margin-top: 0;
}

.split-row .split-image img {
  width: 100%;
  height: auto;
}

@media (max-width: 768px) {
  .split-row {
    flex-direction: column;
    gap: 0;
  }
}
</style>