

Appearance
Analytics integration
In short
- Event: a
dalton_experimentevent with the variant ID goes to the data layer for every visitor in a test. - Any tool: GTM, Segment or your warehouse can read it. With GA4 through GTM, import our container template.
- In GA4: register
variantIdas a custom dimension and compare variants in an exploration. - Totals: won't match Dalton exactly; check that both point the same way.
Events · Shopify orders · Setup in GA4 · Confirm experiment data · Google Tag Manager
Events Sent to Google Analytics
On every page visit where an experiment is active, Dalton sends this event:
| Event | Parameter | Value | Purpose |
|---|---|---|---|
dalton_experiment | variantId | The variant's ID | Which variant the visitor is in. The original has its own ID, so every visitor in the test gets the event |
testId | The experiment's ID | Which experiment the event is for, one event per running experiment |
Where to find the variant IDs: open the experiment in Dalton. The experiment detail screen shows the ID of each variant. Note the IDs of the variants you want to compare, because you'll need them to build the report below.
Always pushed to the data layer
The event is pushed to window.dataLayer on every qualifying page visit, even if you haven't connected GA4 to Dalton. You can pick it up in GTM, Segment or any other tool that reads the data layer, and send it on to your own warehouse to split your own metrics by variant.
Read the variant in your own code
Your theme or your own scripts can read the same events from window.dataLayer:
js
const seen = (window.dataLayer || []).filter(e => e.event === 'dalton_experiment')
// e.g. [{ event: 'dalton_experiment', testId: 1234, variantId: 5678 }]
Each running test adds one entry. On sites without Google Tag Manager or gtag, Dalton still pushes them, about half a second after the page loads.
Variants on Shopify orders
With the Dalton Shopify app, every order also carries the variants the buyer saw, as order attributes. Join them to your order data to split anything by variant: margin, subscriptions, returns.
| Attribute | Contains |
|---|---|
_dalton_session | The visitor's Dalton session ID |
_dalton_device | The visitor's device ID |
_dalton_attribution | JSON: v (format version, 1), s session, d device, i the tests and variants seen as [testId, variantId] pairs, r 1 for a returning visitor |
The app's theme embed adds these to the cart as soon as Dalton has a session. With the snippet installed by hand in theme.liquid, orders don't get them. The Dalton Shopify app is in review; ask us for early access.
Without the app, your developer can add the variants to the cart themselves, from the data layer events above. For example, when the cart opens or an item is added:
js
const tests = (window.dataLayer || [])
  .filter(e => e.event === 'dalton_experiment')
  .map(e => [e.testId, e.variantId])
fetch('/cart/update.js', {
  method: 'POST',
  headers: { 'Content-Type': 'application/json' },
  body: JSON.stringify({ attributes: { _dalton_variants: JSON.stringify(tests) } }),
})
Attributes that start with _ stay hidden from shoppers at checkout and show on the order in your Shopify admin.
Setup in Google Analytics
Step 1: Verify Events Are Coming In
Before you set anything up, confirm that GA4 is receiving Dalton's events.
- In GA4, go to Reports → Realtime → Overview
- Open a page on your site where a Dalton experiment is active
- In the Realtime report, check the Event count by Event name card and confirm that a
dalton_experimentevent shows up and is counting
If dalton_experiment appears, data is flowing and you can continue. If it doesn't show up within a minute or two, the events aren't reaching GA4 yet. If your GA4 runs through GTM, see the Google Tag Manager section below.
Step 2: Register variantId as a Custom Dimension
Register the variantId parameter as a custom dimension so you can use it in segments, explorations and audiences.
- Go to Admin → Custom definitions → Custom dimensions
- Click Create custom dimension
- Set:
- Dimension name:
Dalton Variant ID(the label you'll see in reports) - Scope: Event
- Event parameter:
variantId
- Dimension name:
- Click Save
No backfill
Custom dimensions only apply to data collected after they're created, and can take 24–48 hours to populate. Create this before (or as soon as) you launch the experiment.
Confirm Experiment Data in GA4
With variantId registered, you can build a report that compares the variants of an experiment side by side on your own GA4 metrics.
Step 1: Create a segment per variant
- In GA4, go to Explore and start a Blank exploration. Name it after the experiment.
- Set the date range to the dates the experiment has been running.
- Next to Segments, click + and choose Session segment.
- Name it after the variant (for example
Variant A – <variant ID>). - Add a condition: pick the
dalton_experimentevent, click Add parameter, choose Dalton Variant ID, and set it to exactly matches that variant's ID. - Click Save and apply.
- Repeat for the other variant, so you end up with one segment per variant ID.
Purchases in a later session
A session segment only counts purchases made in the same session the visitor saw the variant. If your customers often buy on a later visit, create User segments with the same condition instead.
Step 2: Build the comparison
- Under Dimensions, click + and add Device category, then drag it into Rows. This splits the numbers by device, and a Totals row shows the overall figure for each variant.
- Under Metrics, click + and add the metrics you want to compare, for example:
- Sessions
- Ecommerce purchases
- Purchase revenue
- Session key event rate (conversion rate)
- Average purchase revenue
- Drag the metrics into Values.
- Drag both variant segments into Segment comparisons.
The table now shows each variant side by side, with its sessions, purchases, revenue and conversion rate from your own GA4 data.
Expect the numbers to differ from Dalton
GA4 and Dalton attribute sessions differently, filter bots differently, and are affected differently by consent settings and ad blockers. GA4 also samples large explorations. The absolute numbers won't match Dalton exactly. What matters is whether the two sources point in the same direction. For the uplift figure and its confidence interval, use the experiment's results screen in Dalton. See Why numbers differ from Shopify and GA4.
Google Tag Manager
If your GA4 setup runs through Google Tag Manager, the dalton_experiment event and its variantId parameter won't reach GA4 unless you forward them with a tag in GTM.
📥 Download the GTM container template and import it into GTM to set everything up in one go.
To import the template:
- In GTM, go to Admin → Import Container
- Select the downloaded file
- Choose your workspace
- Pick Merge (so it doesn't overwrite your existing setup) and confirm
- Publish
Important: set your own GA4 Measurement ID
The template ships with a placeholder ID, so you must replace it with your own before you publish. In GTM, click the created Dalton_Tag and set the Google Analytics Measurement ID field to your GA4 Measurement ID (the G-XXXXXXXXXX). Until you do, no events will reach your GA4 property.
Where to find your Measurement ID:
- Log in to your Google Analytics account
- Click Admin (the gear icon) in the bottom-left corner
- Under the Property column, click Data collection and modification, then select Data streams
- Click the Web tab and select your website's data stream
- Your Measurement ID is displayed in the top-right corner of the stream details window
If you'd rather build it by hand, you don't need to set up the variables and trigger first. Start from a new tag and create them inline as you go.
Step 1: Get your GA4 Measurement ID
Copy your GA4 Measurement ID (the G-XXXXXXXXXX): in GA4, Admin → Data collection and modification → Data streams → Web, then your stream. You'll paste it into the tag in the next step.
Step 2: Create the GA4 Event tag
Go to Tags → New, click Tag Configuration, and choose Google Analytics: GA4 Event. Name the tag Dalton_Tag and set:
- Measurement ID: paste the
G-XXXXXXXXXXyou copied in Step 1 - Event Name: click the variable picker (the icon to the right of the field), pick Built-In Variables, and enable/select Event so the field becomes
{{Event}}. This forwards the original event name (dalton_experiment) unchanged.
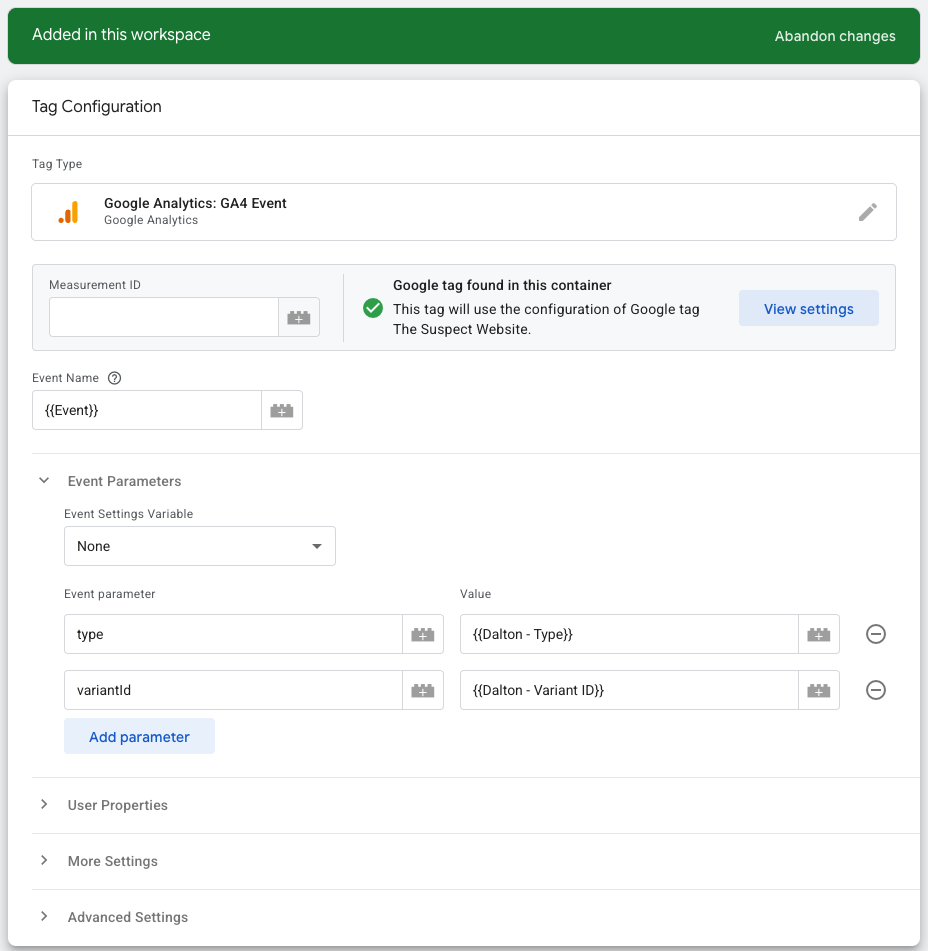
Step 3: Add the event parameters (creating the variables inline)
Still in the tag, expand Event Parameters and click Add Row for each parameter. For each row, click the variable picker on the Value field, then + (New Variable) → Data Layer Variable to create it on the spot:
| Parameter Name | New variable | Data Layer Variable Name |
|---|---|---|
variantId | Dalton - Variant ID | variantId |
type | Dalton - Type | type |
variantId is the one you need for experiment reporting. The type row is included in the container template, and you can leave it in.
Each Data Layer Variable should look like this (here, Dalton - Type reading the type key):
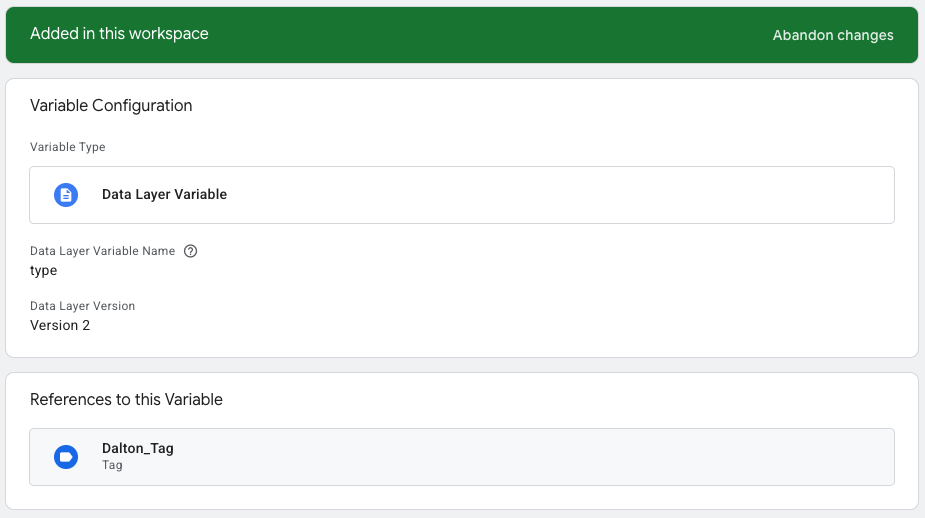
Step 4: Add the firing trigger (created inline)
Still in the same tag, click the Triggering box, click + (New) in the top-right, then choose Trigger Configuration → Custom Event and set:
- Name:
Dalton - All Events - Event name:
dalton*with use matches RegEx ticked. This fires ondalton_experiment.
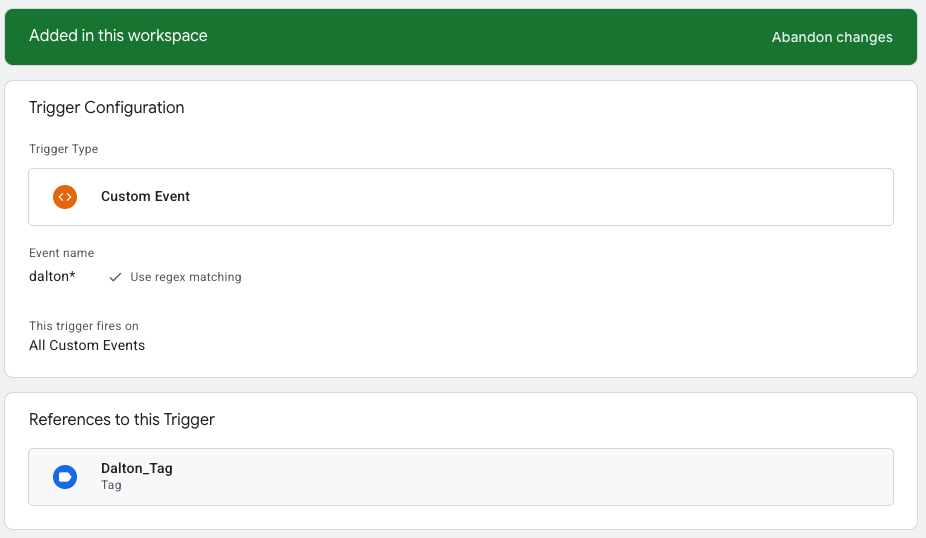
Save the trigger, then Save the tag. Your finished tag should look like this:
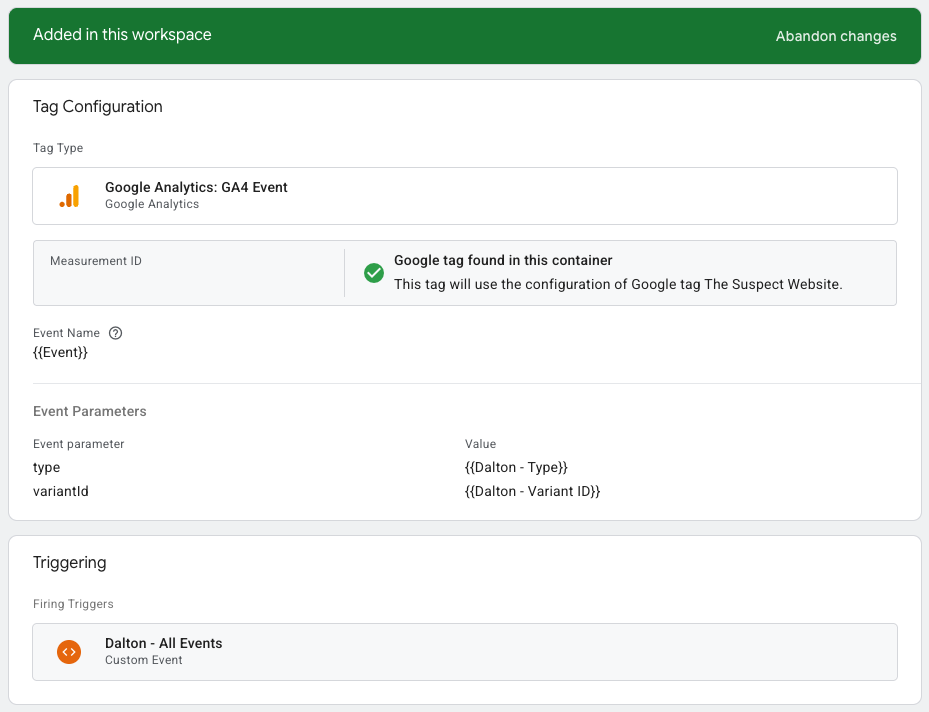
Step 5: Preview and publish
Before publishing, click Preview in GTM and load a page on your site where a Dalton experiment is active. In the Tag Assistant preview window, you should see Dalton_Tag fire on the dalton_experiment event with the variantId parameter populated.
To check it's reaching GA4, go to Reports → Realtime → Overview in Google Analytics. You should see dalton_experiment events coming in.
Once that looks right, click Submit / Publish to make the container live.
Custom events blocked in GTM?
Some GTM setups restrict which custom events can be forwarded to GA4. If dalton_experiment isn't showing up in GA4, check that the Dalton - All Events trigger isn't blocked by an exception or a consent setting, and that it's set as the tag's firing trigger.
Step 6: Continue in Google Analytics
Once the events are reaching GA4, register the custom dimension and build your report.