Appearance
Results Dashboard
Track how your experiments are performing.
Overview Tab
High-level performance across all experiments:
- Projected Uplift - The expected uplift when continuing to use Dalton
- Current Conversion Lift
- Mean Conversion Dalton vs Holdout
- Sessions Analysed - Total tracked sessions
What is "Holdout"?
A holdout is a small portion of your traffic (20% by default) that always sees your original, unmodified pages. By comparing the conversion rate of this group against visitors who see Dalton's optimized variants, you can measure the true impact of using Dalton. You can adjust the holdout percentage in the page settings.
Understanding the Learning Phase
When you launch an experiment, Dalton enters a learning phase before meaningful results appear.
What Dalton needs to start reporting
| Requirement | Why |
|---|---|
| ~250 sessions | Minimum data to detect patterns |
| ~100 conversion events | Enough conversions to compare variants reliably |
How fast you hit these thresholds depends entirely on your traffic. High-traffic pages may reach them in days; lower-traffic pages take longer.
What happens during learning
- Traffic splits equally — All variants get the same traffic initially
- Data accumulates — Dalton tracks sessions and conversions per variant
- Algorithm activates — Once thresholds are met, traffic starts shifting toward winners
- Optimization continues — Winners get more traffic, losers get less
Don't jump on early results
A variant might show +50% one day and -10% the next. This is normal. Until you have enough data, the numbers fluctuate wildly. Wait for significance indicators before drawing conclusions.
Patience pays off
The #1 mistake is reacting too early. Let the algorithm gather data. If you stop experiments before significance, you're just guessing.
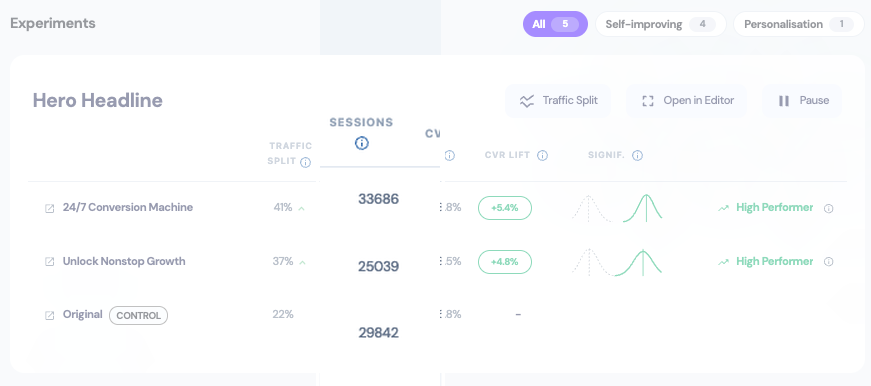
All Experiments Tab
Detailed performance for each variant:
| Column | Meaning |
|---|---|
| COPY | Variant text being tested |
| SPLIT | Traffic distribution (multi-armed bandit allocation) |
| SESSIONS | Number of sessions |
| CVR LIFT | Conversion improvement vs baseline |
| SIGNIF | Statistical significance indicator |
When to Trust Results
- Look for 95%+ certainty before making permanent decisions
- Wait 2-4 weeks minimum for the algorithm to learn
- Don't react to daily changes - focus on trends over time
When to Pause
Trust the Algorithm
Pause only for urgent page changes, not based on performance. The algorithm automatically reduces traffic to underperformers.