

Appearance
How Experiments Run
Every Dalton experiment is a straight A/B test. Traffic splits evenly between your original page and each variant, the split never moves, and the result is read at the end of a window fixed before launch.
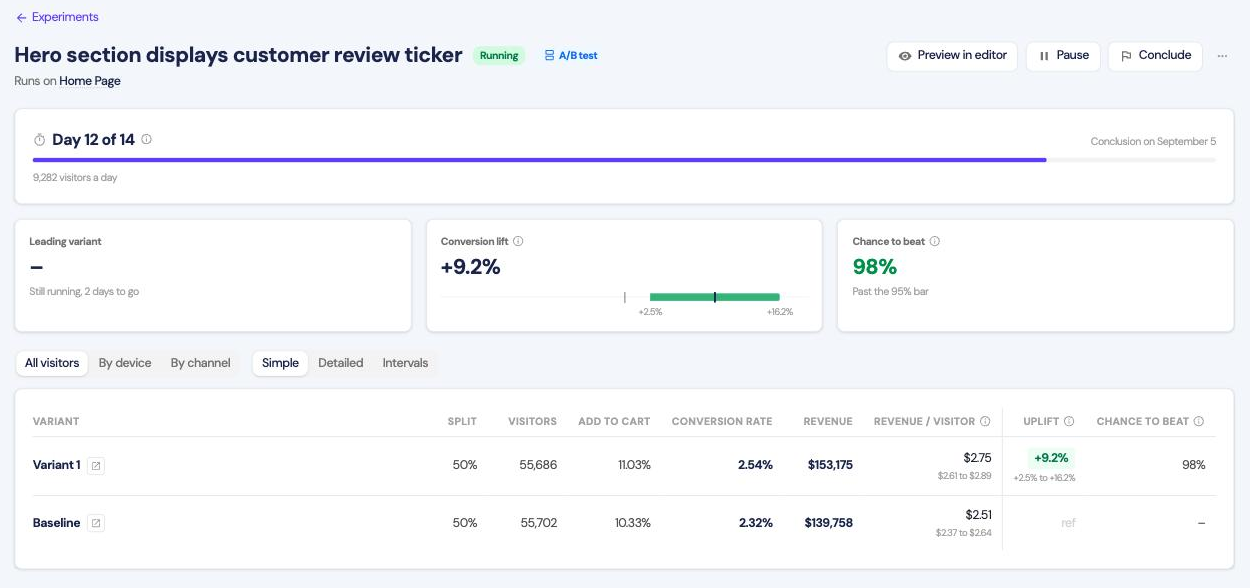
The planned window
Dalton sets a conclusion date before the test starts, based on the traffic the targeted pages get.
| Window | Given when |
|---|---|
| 2 weeks | The pages can send about 5,000 visitors to each variant in that time |
| 4 weeks | They need longer |
| 6 weeks | They cannot reach it. Also the hard ceiling |
Windows are always whole weeks, so a run counts the same number of Mondays as Saturdays. For the first three days the plan shows as two weeks and is provisional, until there is enough traffic to project from.
Days only count while the test is collecting. Pausing does not advance the countdown.
Check the window before you launch
The targeting picker estimates time to results before you commit. Widening the targeting is cheaper than waiting. See Targeting Groups.
Why no leader appears early
While a test runs, no winner is named, even when the numbers look convincing. Lift and chance to beat are shown throughout, but the verdict waits until the window completes.
Stop a test the moment it looks good and you will stop it on the days it happened to look good. There is one exception, using a calculation that stays valid however often it is checked:
- A clear loser is flagged for early stopping after at least 7 days, once every variant has 50 conversions and every variant is decisively behind.
What Dalton needs before it reports
Figures show as a dash until every variant, including the original, clears both bars:
- 350 visitors
- 50 conversions
Conversions are the binding one. A page converting at 0.5% clears 350 visitors on two orders, and one more order then swings the lift by tens of percent.
Calling the result
When the window closes, Dalton compares each variant with the original on two measures: conversion rate and revenue per visitor. A variant wins when its chance to beat on either one reaches your account's bar. If several variants win, the one with the highest revenue per visitor is named.
The bar is 90% by default. Set it to 80, 85, 90 or 95% under Settings → Experiments → When to call a winner. Higher is more certain and finds fewer winners.
| Chance to beat, at the default 90% bar | Verdict |
|---|---|
| 90%+ | Winner. Deploy it, or conclude it |
| 80-90% | Promising. Worth another week if under the six-week ceiling |
| 10-80% | No difference |
| 10% or less | Control won |
A variant that converts more people but earns less revenue per visitor is never called a winner. It reads as No difference. Revenue only counts once the variant and the original each have 50 orders.
A test that runs its full window without clearing the data bars reads Not enough data. The page is too quiet for that question, and running it longer will not fix it.
While it runs
- Do not stop a test on a bad day three unless Dalton flagged it.
- Do not edit the original page mid-test.
- Pause if something is broken. Changes revert instantly.
Next: Reading Your Results.